Weighted FFT estimators for 1D and 3D correlations of the Lyman- forest
Abstract
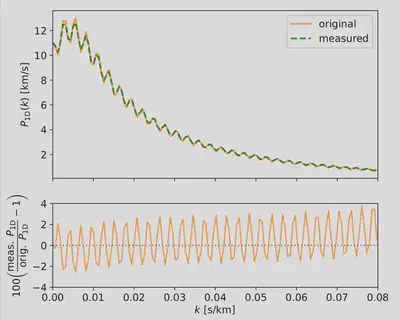
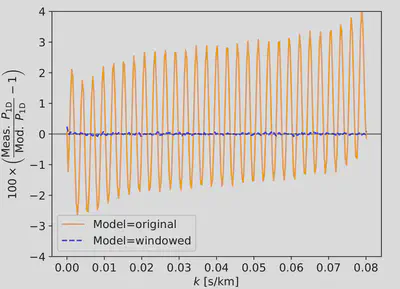
Correlations in the Lyman- (Ly ) forest, both as a function of line of sight separation (1D) and 3D separation, provide a unique window to the distribution of matter at redshifts not accessible by current galaxy surveys. While optimal quadratic estimators have been used to measure 1D correlations, they are computationally expensive and difficult to extend to 3D analyses. On the other hand, estimators based on the Fast Fourier Transform (FFT) are significantly faster, but are affected by missing data in the spectra (masked pixels) and so far have not used pixel weights to reduce the uncertainties in the measurement. In this publication we describe how to compute the window matrix that enables forward-modeling the impact of masked pixels and weights on the FFT-based estimators. We use Gaussian and hydrodynamical simulations with artificially masked pixels to validate the method on the measurement of 1D correlations. Finally, we show that the formalism can be extended to model the impact on 3D correlations, in particular on the cross-spectrum, the correlation of 1D Fourier modes as a function of transverse separation. This work will enable more precise clustering measurements with the Ly forest dataset recently collected by the Dark Energy Spectroscopic Instrument (DESI).