Lyman-$\alpha$ forest holography: 3D predictions from 1D measurements
Abstract
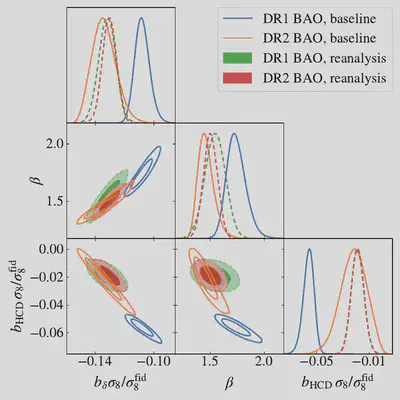
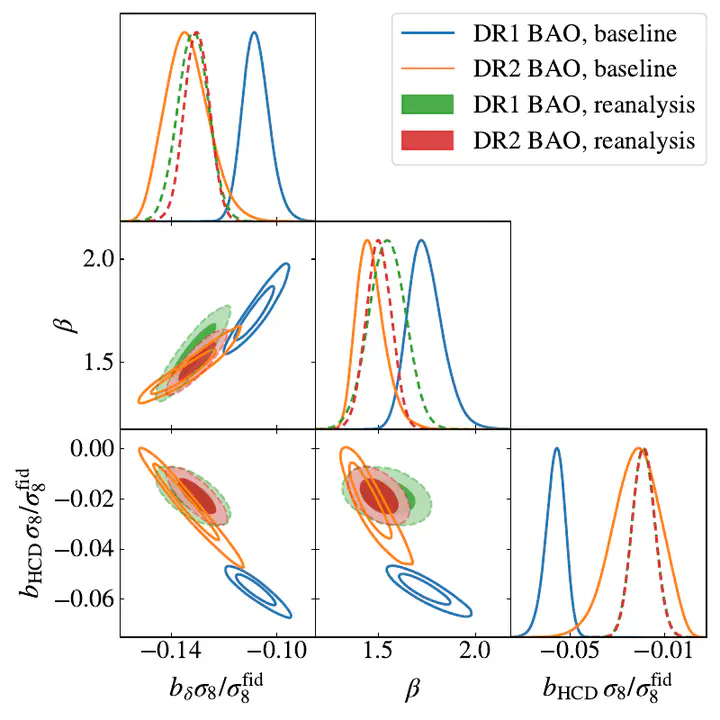
Cosmological analyses of Lyman-$\alpha$ forest clustering rely on either one-dimensional correlations along individual sightlines or three-dimensional correlations between different sightlines. Because these observables probe the matter distribution on very different scales, they have traditionally been analyzed independently. In this work, we bridge this gap using ForestFlow, an emulator trained on a suite of cosmological hydrodynamical simulations that provides a unified description of Lyman-$\alpha$ forest clustering from linear to nonlinear scales. This framework enables us to determine the range of three-dimensional clustering models compatible with the DESI one-dimensional flux power spectrum ($P_{\rm 1D}$). The resulting predictions successfully reproduce the large-scale clustering measured by the DESI BAO analysis and provide physically motivated priors on nonlinear clustering that are used in a companion paper presenting the full-shape analysis of the DESI DR2 Lyman-$\alpha$ forest. We validate our methodology using the large-volume, high-resolution hydrodynamical simulation ACCEL-2, demonstrating excellent agreement across the full range of scales considered. Finally, we combine constraints from the $P_{\rm 1D}$ and BAO analyses on the parameter combinations $b_\delta \sigma_8$ and $b_\eta f \sigma_8$, finding that the two probes provide comparable constraining power while exhibiting complementary parameter degeneracies. Our results establish a direct connection between one- and three-dimensional Lyman-$\alpha$ forest measurements through ForestFlow, an approach we term Lyman-$\alpha$ holography by analogy with the reconstruction of higher-dimensional structure from lower-dimensional information.